BCS Enters Final Phase of FDA MDDT Program to Qualify First-in-Industry Platform to Standardize Cancer Diagnostic Assays

    Contact Us
  • About Us
  • IHC Challenges
  • Products
    • BCS Quality Platform For IHC
    • IHCalibrators® Product Menu
    • IHControls® Product Menu
  • Custom Solutions
  • News
  • Learning Center
    • Overview
    • Metric Calibration and SPC Tutorials
    • IHC: Past – Present – Future
Boston Cell Standards
Contact Us
  • About Us
  • IHC Challenges
  • Products
    • BCS Quality Platform For IHC
    • IHCalibrators® Product Menu
    • IHControls® Product Menu
  • Custom Solutions
  • News
  • Learning Center
    • Overview
    • Metric Calibration and SPC Tutorials
    • IHC: Past – Present – Future

Metric Calibration Tutorial

11
  • Overview
  • Module 1. Introduction
  • Module 2. What are IHCalibrators®?
  • Module 3. Metric Calibration Workflow Steps
  • Module 4. Understanding Metric Calibration Report
  • Module 5. Selecting an IHControl for Statistical Process Control (SPC)
  • Module 6. Understanding Lower Limit Of Detection (LOD)
  • Module 7. Compare LOD With Peer Labs
  • Module 8. Why Does LOD Affect Tissue Staining?
  • Module 9. Avoid Strong Positive Tissue Controls
  • Module 10. Summary: Understanding Metric Calibration

Metric SPC Tutorial

7
  • Overview
  • Module 1. Introduction
  • Module 2. What are IHControls®?
  • Module 3. Metric SPC Workflow Steps
  • Module 4. Understanding the Metric SPC Report
  • Module 5. Interpreting the Metric Levey-Jennings Graph
  • Module 6. Summary: Understanding Metric SPC
View Categories
  • Home
  • Learning Center
  • Metric Calibration Tutorial
  • Module 2. What are IHCalibrators®?

Module 2. What are IHCalibrators®?

< 1 min read

Physical Characteristics

BCS IHCalibrators, which enable IHC Calibration, are described below. (Figure 1)

  • 15 small round spots pre-printed on a microscope slide.
  • The spots are glass microbeads covalently coated with a biomarker.
  • Each bead has a defined concentration of biomarker traceable to a primary NIST standard.
  • The numbers provide an orientation to the sequence of increasing biomarker concentrations.
  • A certificate of analysis provides the exact concentration for each level.
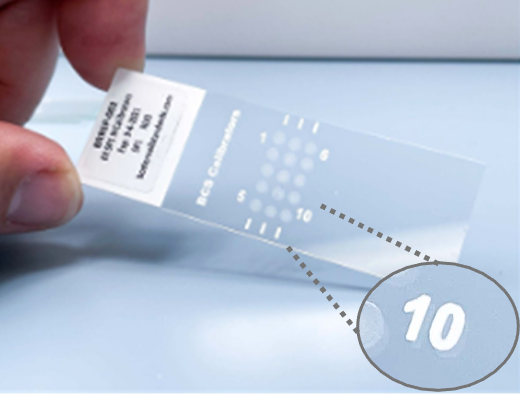
 

Figure 1. IHCalibrators


Schematic Representation and Photomicrographs

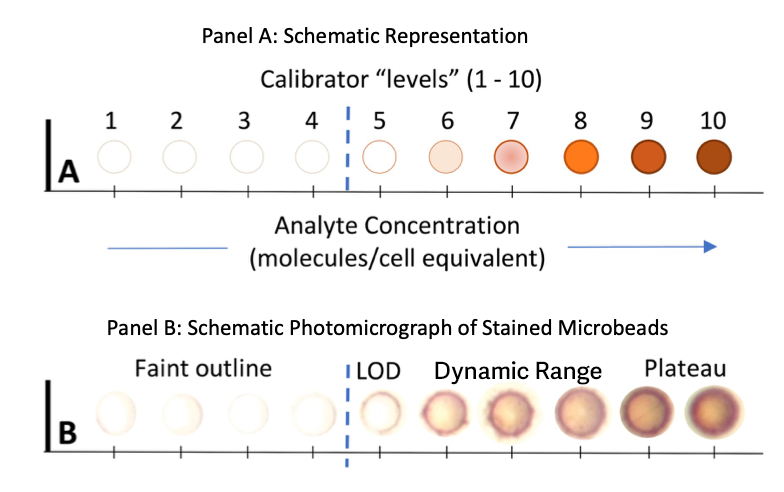
Figure 2 below provides a schematic representation of Calibrator levels 1-10 (Panel A) and photomicrographs of the stained microbeads (Panel B). The actual LOD is likely at a concentration between levels 4 and 5.

  • Identify the lowest concentration level that is still stained.
  • In these examples, level 5 is the lowest that still has sufficient color intensity to consider positive.
  • Look at the Certificate of Analysis for the calibrator and correlate it with the actual concentration.
  • The actual Lower Limit of Detection (LOD) is likely at a concentration between levels 4 and 5.
  • Metric calculates the precise LOD.


Figure 2. Schematic Representations of Calibrator Levels and Photomicrographs

Updated on August 10, 2026
Module 1. IntroductionModule 3. Metric Calibration Workflow Steps
Boston Cell Standards

Innovative products delivering essential IHC performance metrics

Follow Us
About Us Overview BCS History Leadership Advisors
IHC Challenges Overview
Products Platform Overview IHCalibrators® Product Menu IHControls® Product Menu
News Press Releases
Learning Center
Custom Solutions

© 2026 Boston Cell Standards. FCOI Policy