BCS Enters Final Phase of FDA MDDT Program to Qualify First-in-Industry Platform to Standardize Cancer Diagnostic Assays

    Contact Us
  • About Us
  • IHC Challenges
  • Products
    • BCS Quality Platform For IHC
    • IHCalibrators® Product Menu
    • IHControls® Product Menu
  • Custom Solutions
  • News
  • Learning Center
    • Overview
    • Metric Calibration and SPC Tutorials
    • IHC: Past – Present – Future
Boston Cell Standards
Contact Us
  • About Us
  • IHC Challenges
  • Products
    • BCS Quality Platform For IHC
    • IHCalibrators® Product Menu
    • IHControls® Product Menu
  • Custom Solutions
  • News
  • Learning Center
    • Overview
    • Metric Calibration and SPC Tutorials
    • IHC: Past – Present – Future

Metric Calibration Tutorial

11
  • Overview
  • Module 1. Introduction
  • Module 2. What are IHCalibrators®?
  • Module 3. Metric Calibration Workflow Steps
  • Module 4. Understanding Metric Calibration Report
  • Module 5. Selecting an IHControl for Statistical Process Control (SPC)
  • Module 6. Understanding Lower Limit Of Detection (LOD)
  • Module 7. Compare LOD With Peer Labs
  • Module 8. Why Does LOD Affect Tissue Staining?
  • Module 9. Avoid Strong Positive Tissue Controls
  • Module 10. Summary: Understanding Metric Calibration

Metric SPC Tutorial

7
  • Overview
  • Module 1. Introduction
  • Module 2. What are IHControls®?
  • Module 3. Metric SPC Workflow Steps
  • Module 4. Understanding the Metric SPC Report
  • Module 5. Interpreting the Metric Levey-Jennings Graph
  • Module 6. Summary: Understanding Metric SPC
View Categories
  • Home
  • Learning Center
  • Metric Calibration Tutorial
  • Module 6. Understanding Lower Limit Of Detection (LOD)

Module 6. Understanding Lower Limit Of Detection (LOD)

1 min read

Metric calculates LOD, which quantifies the analytic sensitivity of your assay. LOD is the single most important output of the Metric Calibration Report.

Connecting LOD and Assay Analytic Sensitivity

Figure 7 below shows the connections between LOD and assay analytic sensitivity, tissue stain intensity, and IHC test errors. LOD quantifies assay analytic sensitivity, which in turn affects tissue stain intensity. Tissue stain intensity is responsible for the majority of IHC staining errors.
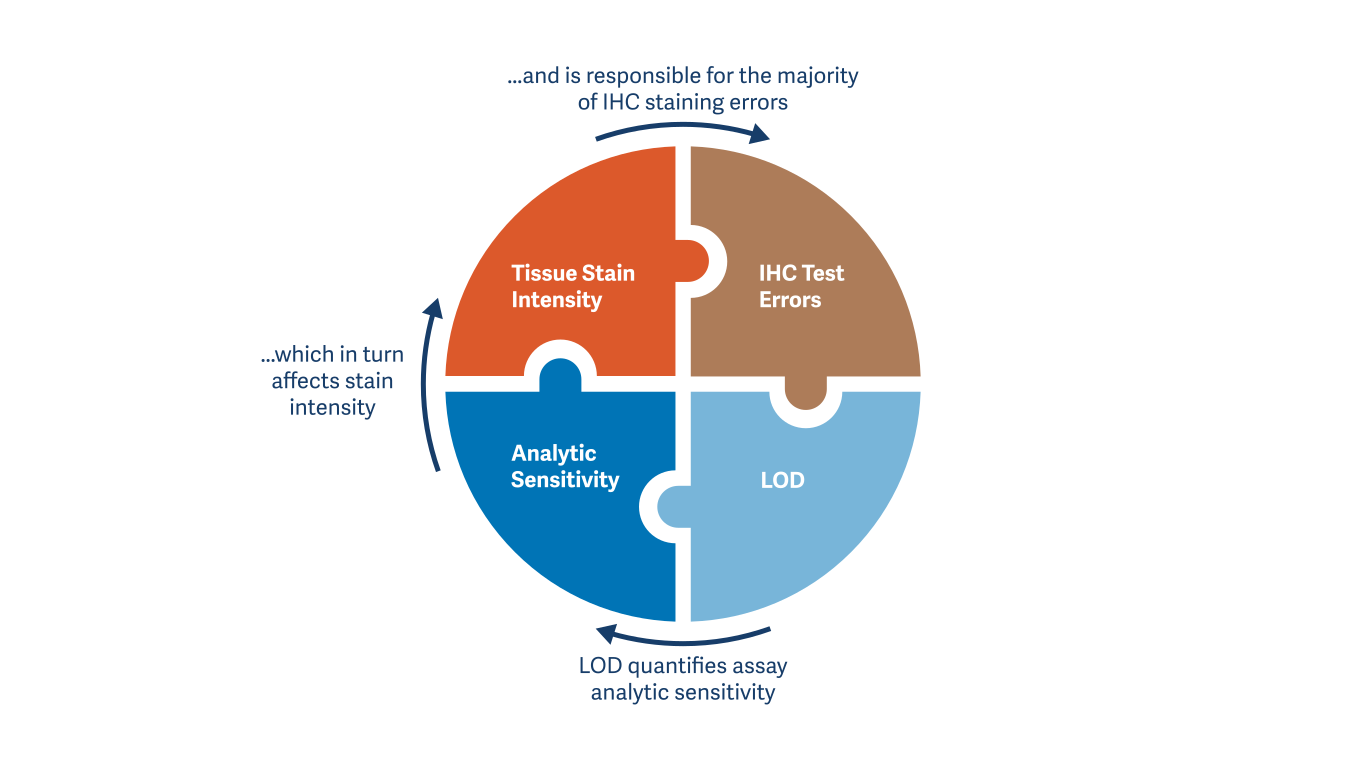
Figure 7. Connections Between LOD And Assay Analytic Sensitivity, Tissue Stain Intensity, and IHC Test Errors


Low LOD

A low LOD means that your assay is highly sensitive, which yields strong tissue staining, producing an accurate IHC test result (Figure 8). Without calibration data, accurate staining has been used to infer a proper LOD. Directly measuring LOD to confirm accurate staining is better science.
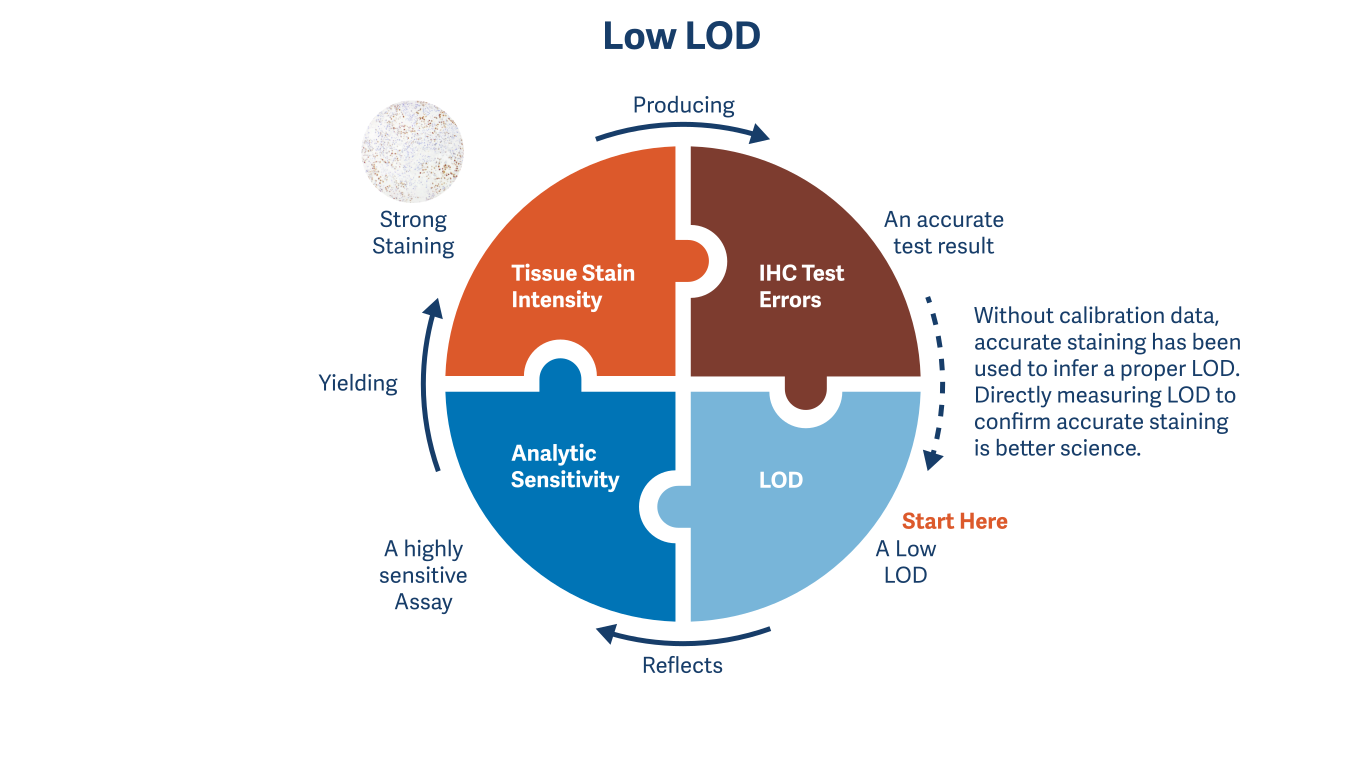
Figure 8. Low LOD Example


High LOD

In contrast, a high LOD means that your assay is highly insensitive, which can yield weak to no tissue staining, and inaccurate IHC test results (Figure 9). IHC Calibration is the only quantified and accurate method for determining the analytic sensitivity of your IHC assay.
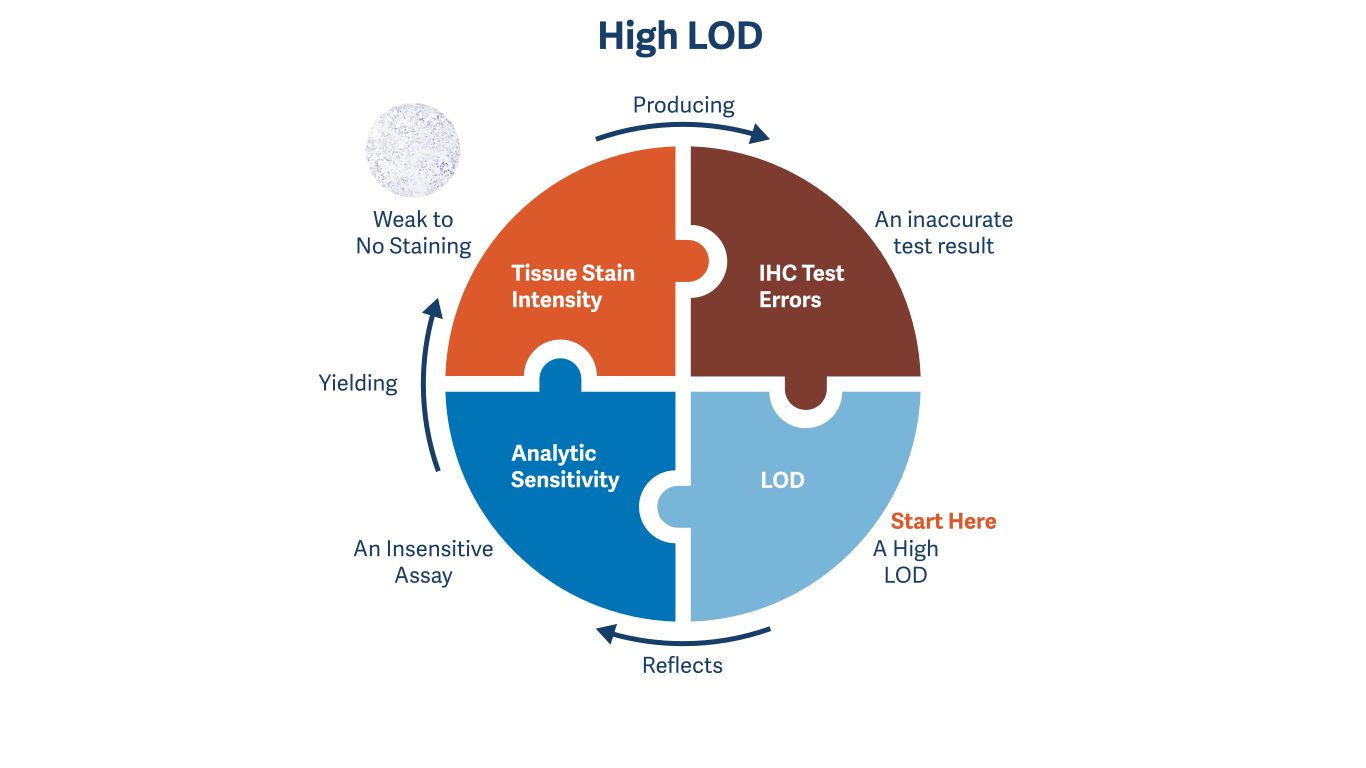
Figure 9. High LOD Example

Updated on August 14, 2026
Assay IHControl LOD Lower Limit of Detection Statistical process Control
Module 5. Selecting an IHControl for Statistical Process Control (SPC)Module 7. Compare LOD With Peer Labs
Boston Cell Standards

Innovative products delivering essential IHC performance metrics

Follow Us
About Us Overview BCS History Leadership Advisors
IHC Challenges Overview
Products Platform Overview IHCalibrators® Product Menu IHControls® Product Menu
News Press Releases
Learning Center
Custom Solutions

© 2026 Boston Cell Standards. FCOI Policy