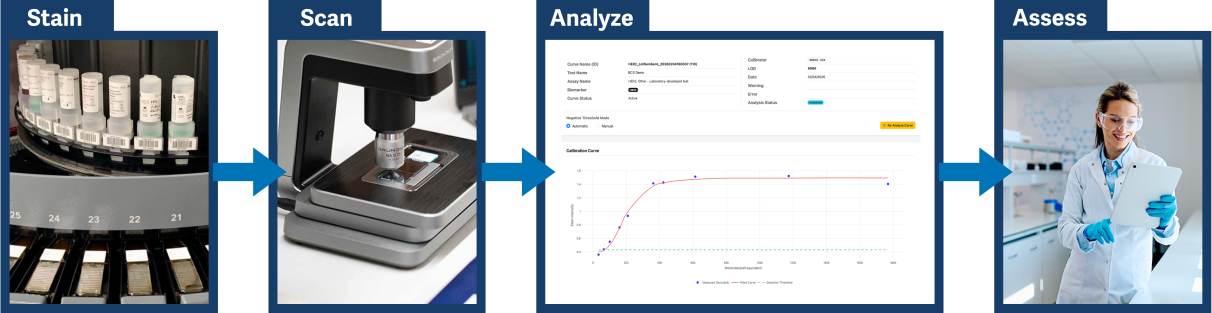
Figure 3. Metric Calibration Workflow
BCS’ Calibration Workflow fits seamlessly into your lab’s existing IHC Workflow.
Calibration Workflow Step 1: Stain
Your IHC lab should stain the IHCalibrators slide using the identical processes used for staining patient tissue samples.
Calibration Workflow Step 2: Scan
Once the IHCalibrators slide has been stained following the identical processes used within your IHC lab for staining patient tissue samples, you next need to acquire images from the calibrator slide and upload the images to Metric.
Calibration Workflow Step 3: Analyze
Once you have uploaded Calibrator slide images to Metric, the IHCalculations software automatically analyzes the images and quantifies the stain intensity of the images and then produces a Calibration Report that includes calculation of Lower Limit of Detection (LOD) and other statistics. The Calibration Report also illustrates assay dynamic range.
Calibration Workflow Step 4: Assess
Using the Calibration Report and LOD calculation, you can compare the performance of your lab’s assay with peer labs running the same assay. If your lab’s LOD is much higher than the LODs for peer labs, you can investigate why this result occurs and then take corrective actions.