BCS Enters Final Phase of FDA MDDT Program to Qualify First-in-Industry Platform to Standardize Cancer Diagnostic Assays

    Contact Us
  • About Us
  • IHC Challenges
  • Products
    • BCS Quality Platform For IHC
    • IHCalibrators® Product Menu
    • IHControls® Product Menu
  • Custom Solutions
  • News
  • Learning Center
    • Overview
    • Metric Calibration and SPC Tutorials
    • IHC: Past – Present – Future
Boston Cell Standards
Contact Us
  • About Us
  • IHC Challenges
  • Products
    • BCS Quality Platform For IHC
    • IHCalibrators® Product Menu
    • IHControls® Product Menu
  • Custom Solutions
  • News
  • Learning Center
    • Overview
    • Metric Calibration and SPC Tutorials
    • IHC: Past – Present – Future

Metric Calibration Tutorial

11
  • Overview
  • Module 1. Introduction
  • Module 2. What are IHCalibrators®?
  • Module 3. Metric Calibration Workflow Steps
  • Module 4. Understanding Metric Calibration Report
  • Module 5. Selecting an IHControl for Statistical Process Control (SPC)
  • Module 6. Understanding Lower Limit Of Detection (LOD)
  • Module 7. Compare LOD With Peer Labs
  • Module 8. Why Does LOD Affect Tissue Staining?
  • Module 9. Avoid Strong Positive Tissue Controls
  • Module 10. Summary: Understanding Metric Calibration

Metric SPC Tutorial

7
  • Overview
  • Module 1. Introduction
  • Module 2. What are IHControls®?
  • Module 3. Metric SPC Workflow Steps
  • Module 4. Understanding the Metric SPC Report
  • Module 5. Interpreting the Metric Levey-Jennings Graph
  • Module 6. Summary: Understanding Metric SPC
View Categories
  • Home
  • Learning Center
  • Metric Calibration Tutorial
  • Module 7. Compare LOD With Peer Labs

Module 7. Compare LOD With Peer Labs

1 min read

The LOD calculation provided in the Metric Calibration Report provides quantification of your assay’s analytic sensitivity. You can compare your assay’s LOD with those of peer labs from sources outlined below Figure 6.

Analytic sensitivity, as measured by the lower limit detection (y axis), for the various commercial assays by participating laboratories (x axis). Each dot is a separate laboratory. A box is also illustrated with each data set showing the median, 25th and 75th quartiles, calculated exclusive of the median because each group has an even number of samples. Assay nomenclature: “4B5 (per IFU)” is the Roche PATHWAY assay without modification; “4B5 LDT” is the same reagents and instrument but after modification of the protocol, often extending an incubation time; “4B5+Optiview” is the same but coupling the primary antibody to the Optiview detection system; “mHercepT” is the Agilent DG44 monodonal HercepTest on the Dako Omnis; “CB11/Bond” is the Leica Biosystems CB11 primary antibody pre-dilute on a Leica immunostainer. Lower limit of detection (y axis) is in ERF units per cell equivalent and is intended to be multiplied x 1000.
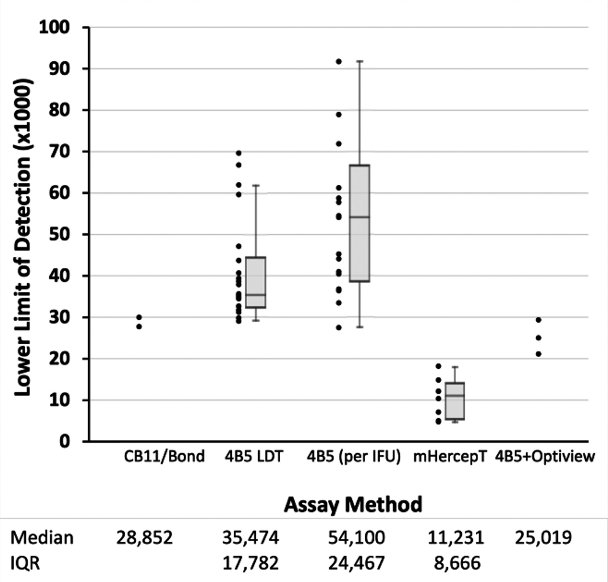
Figure 6. Comparison Of Assay LOD With Those Of Peer Labs — Dabbs, D., et al. New standards in HER2-low testing: the CASI-01 comparative methods study. eBioMedicine2025120:105919


  • Review your lab’s LOD calculated by Metric.
  • Compare your lab’s LOD with those of peer labs. Sources can include:
    • Published research studies (e.g. CASI-01).
    • Consult with your IHC Testing Proficiency organization.
    • Contact your IHC vendor.
    • Contact Boston Cell Standards for a custom report.
Updated on August 10, 2026
IHControl LOD Lower Limit of Detection Report Statistical process Control
Module 6. Understanding Lower Limit Of Detection (LOD)Module 8. Why Does LOD Affect Tissue Staining?
Boston Cell Standards

Innovative products delivering essential IHC performance metrics

Follow Us
About Us Overview BCS History Leadership Advisors
IHC Challenges Overview
Products Platform Overview IHCalibrators® Product Menu IHControls® Product Menu
News Press Releases
Learning Center
Custom Solutions

© 2026 Boston Cell Standards. FCOI Policy