Metric produces an SPC Report, which includes a daily Levey-Jennings graph and related statistics. An example of a Metric SPC Report, with annotations in blue, is shown below in Figure 4. Each report shows the stain intensity for the IHControl stain intensity for the day of the report as well as for previous days.
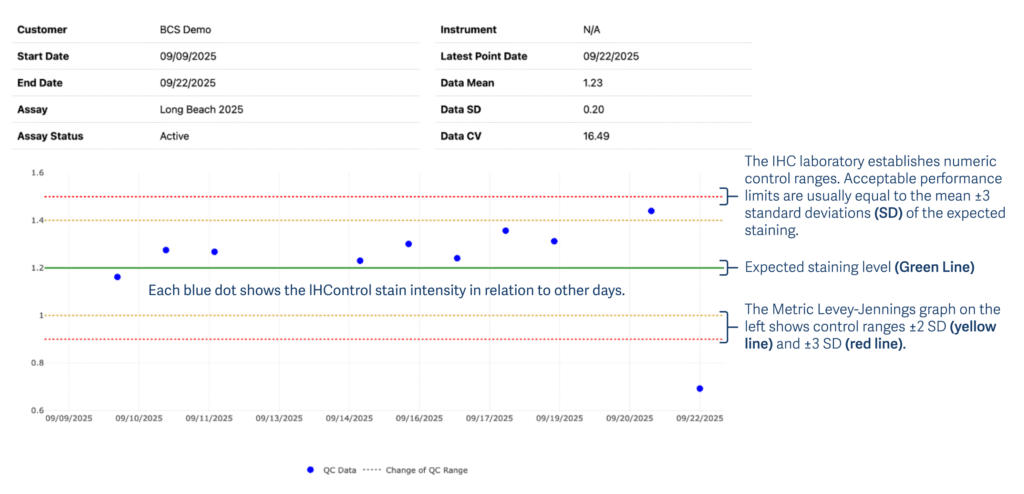
Figure 4. Example Of Metric SPC Report, Including Levey-Jennings Graph And Related Statistics
The daily Levey-Jennings graph tracks QC results over time against an expected mean and acceptable error limits. A control result is expected to vary slightly from day to day, above and below a mean value.
- Each blue dot in the graph above shows the IHControl stain intensity for one day in relation to other days.
- Target Value and Standard Deviation (SD): These are experimentally determined by repetitive testing. Ideally, the mean and SD values are compiled from QC data collected over 10 or more different runs. It is critical that baseline data for target setting represents normal variation only. Do not include outliers or spurious data points when calculating your baseline. In Figure 4 above, the green line shows the mean or expected staining level. Each blue dot is positioned relative to the expected mean.
- Warning SD Multiplier: As a general rule of statistics under normal conditions, approximately 95% of control results will fall within 2 standard deviations (SD) of the mean. Therefore, the Warning Multiplier is often set to 2. A warning QC data point is not an automatic failure, as it will happen ~5% of the time due to random chance, but it merits review. In Figure 4 above, the yellow lines above and below the green expected value line show results that are 2 SD above and below the mean.
- Out of Range SD Multiplier: Approximately 99% of control results should fall within 3 standard deviations of the mean. Therefore, the out-of-range Multiplier is often set to 3. An out-of-range QC data point should be taken seriously; it warrants careful attention and prompts an evaluation of whether the IHC assay was valid. In Figure 4 above, the red lines above and below the green expected value line show results that are 3 SD above and below the mean.
In summary, the daily control values calculated by Metric and shown in the Levey-Jennings graph are typically distributed randomly around a mean.
- Any data points between the mean and 2 SD of the mean represent a QC warning and require review, but do not automatically represent a QC failure.
- Any data points beyond 3 SD of the mean represent a QC failure and should be investigated.